
Solar Output Monitoring Finds Lost Production
By Marquis Mason ·
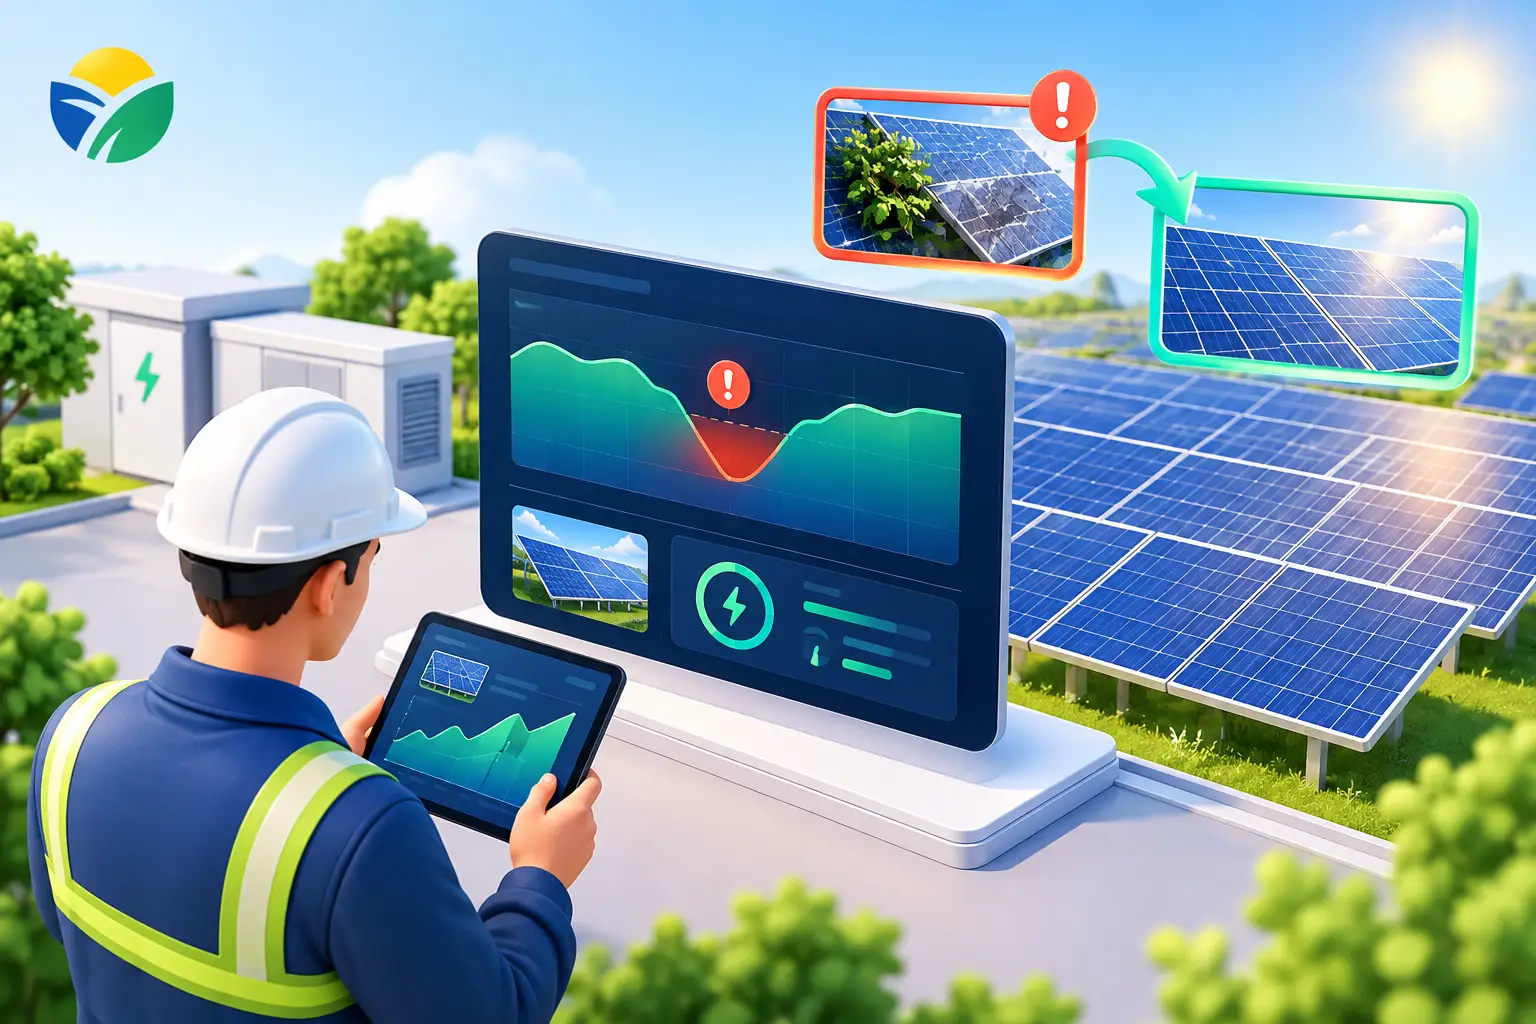
A solar array can look fine from the ground while quietly producing less power every day. Pollen, agricultural dust, bird droppings, pine debris, and mineral residue do not always create an obvious visual problem, but they can block light unevenly across a panel. Solar output monitoring is how an owner turns that suspicion into evidence instead of guessing whether cleaning is worth the cost.
For a system valued at $20,000 or more, production data deserves the same attention as any other performance record. The goal is not to react to one cloudy afternoon. It is to identify a repeatable loss pattern, document the condition of the array, and measure whether cleaning restores output under comparable conditions.
What Solar Output Monitoring Should Tell You
Your monitoring portal usually reports daily, monthly, and lifetime energy production in kilowatt-hours. That is useful, but the most valuable question is simpler: is the system producing what it should for the weather, season, and recent history?
A single day's total can mislead. Temperature, cloud cover, snow cover, shade, and short-term utility or communication interruptions can all affect the number. A clearer signal appears when you compare several similar days or weeks. If sunny or similarly cloudy days are consistently underperforming a prior baseline, the loss deserves a closer look.
For a homeowner, that may mean reviewing the app once a week during high-soiling periods. For a farm, commercial property, or public facility, it may mean recording output on a scheduled basis and retaining reports with cleaning documentation. The right frequency depends on array size, site exposure, and how much revenue or utility offset is tied to each kilowatt-hour.
Start with a useful baseline
The best baseline is your own system's production during a clean, normal operating period. Save a screenshot or export of daily production after cleaning, then note the date, weather conditions, and any visible factors such as heavy pollen or nearby field activity.
Year-over-year comparisons can help, especially when comparing the same month. Still, they are not perfect. A clear May this year will not match a wet May last year, and panels generally produce differently in cool bright weather than in summer heat. Comparing several days with similar weather is more meaningful than comparing one monthly total in isolation.
If your monitoring platform provides expected production, use it as a reference rather than a final answer. Modeled expectations can be useful, but they may not fully account for site-specific soiling, localized shade, or the condition of the panel surface.
The Signs That Point to Soiling
Soiling losses often build gradually. Instead of a dramatic production drop, owners may see an array that is a little behind for several weeks. That slow decline is easy to overlook because the system is still generating power.
The timing can be telling. In Southern Wisconsin, spring pollen can settle into a film that catches more dust. Dry agricultural activity can leave fine residue on rural arrays. Bird droppings and leaf debris create concentrated obstructions that are different from an even layer of dust. Hard-water spotting from improper rinsing can also leave minerals behind, which is why cleaning method matters as much as the decision to clean.
Look for a production pattern that does not line up with weather. If nearby clear days produced similar output earlier in the season but recent clear days are lower, inspect the array visually from a safe location. Do not walk on panels or attempt roof work without proper access and fall protection.
Uneven soiling also matters because it can create uneven electrical loading across cells. A stubborn dropping or dense debris patch can contribute to hot spots, where part of a panel runs hotter than surrounding cells. Monitoring will not always identify the exact dirty panel, but it can show that performance is no longer behaving normally.
How to Compare Output Before and After Cleaning
The cleanest proof comes from a controlled comparison: record production before cleaning, clean with a manufacturer-safe method, then compare output under similar weather conditions afterward. The closer the weather match, the stronger the evidence.
Start by saving at least several days of pre-cleaning production. Include screenshots that show the date and daily kilowatt-hours. Photograph visible buildup when possible, especially bird droppings, pollen film, or mineral spotting. After cleaning, continue saving daily production for the next several comparable days.
Do not expect every post-cleaning day to beat every pre-cleaning day. A sunny day after cleaning will naturally look better than an overcast day before it. The question is whether output rises when sunlight conditions are comparable.
This method has produced measurable results locally. At the Wisconsin State Capitol, documented cleaning was associated with a 16.7% production lift. A Dane County homeowner recorded a 22% daily recovery under identical weather conditions. Those figures are evidence from specific sites, not a blanket promise for every array. Recovery depends on how dirty the panels were, the type of contamination, array angle, season, and weather.
Keep records that can stand up to questions
A useful cleaning record includes the service date, panel condition before cleaning, photos when practical, the cleaning method used, and production screenshots from before and after service. For commercial, agricultural, government, and multi-site owners, retain the invoice and service record with other asset documentation.
This is not paperwork for paperwork's sake. Clear records help show that the panels were cleaned with an appropriate process and that a measurable performance issue was evaluated. If a warranty or insurance question arises later, a dated record is more useful than a verbal recollection that the array was cleaned sometime last spring.
Why Cleaning Method Affects the Data
Monitoring can reveal a loss, but the wrong cleaning approach can create another problem. Abrasive tools, harsh chemicals, pressure washing, and ordinary tap-water rinsing are not a neutral choice for photovoltaic glass and coatings. Tap water can dry into mineral spots, while aggressive methods can risk surface damage.
A proper cleaning process uses purified deionized water and soft, panel-safe brushes. The water lifts away residue without leaving dissolved minerals behind, and the brush action addresses bonded pollen and grime without treating the panels like a driveway. No customer water or power hookup should be necessary when the service provider brings the right equipment.
Solar Alchemist uses a mobile 100% deionized-water rig and soft rotary brushes for a chemical-free, spot-free finish. The point is not simply cleaner-looking glass. It is to remove production-blocking soiling while protecting the asset and creating documentation that connects the service to measured output.
When Monitoring Shows a Problem That Cleaning Will Not Solve
Not every decline is caused by dirt. A monitoring portal may report communication gaps, an outage, unusually heavy snow cover, new shade, or a system-level alert. Cleaning should not be presented as a cure for every production issue.
That is why the production pattern and visual condition should be considered together. If panels visibly carry pollen, dust, or droppings and output has trended down through otherwise comparable weather, cleaning is a reasonable, measurable next step. If the array is visibly clean but the monitoring platform shows alerts or abrupt changes, the data may point elsewhere.
For larger portfolios, establish an action threshold before the busy season. For example, decide who reviews weekly output, what production deviation triggers a visual inspection, and when documented cleaning is approved. That keeps a preventable soiling issue from becoming an afterthought while avoiding unnecessary service based on one imperfect day of data.
The value of solar output monitoring is not the app itself. It is the discipline of noticing a change, documenting the condition, and verifying the result after cleaning. When the numbers improve under comparable weather, you have more than clean panels. You have proof that your solar asset is producing closer to what you paid for.