
How to Calculate What Dirty Solar Panels Are Costing You
By Marquis Mason ·
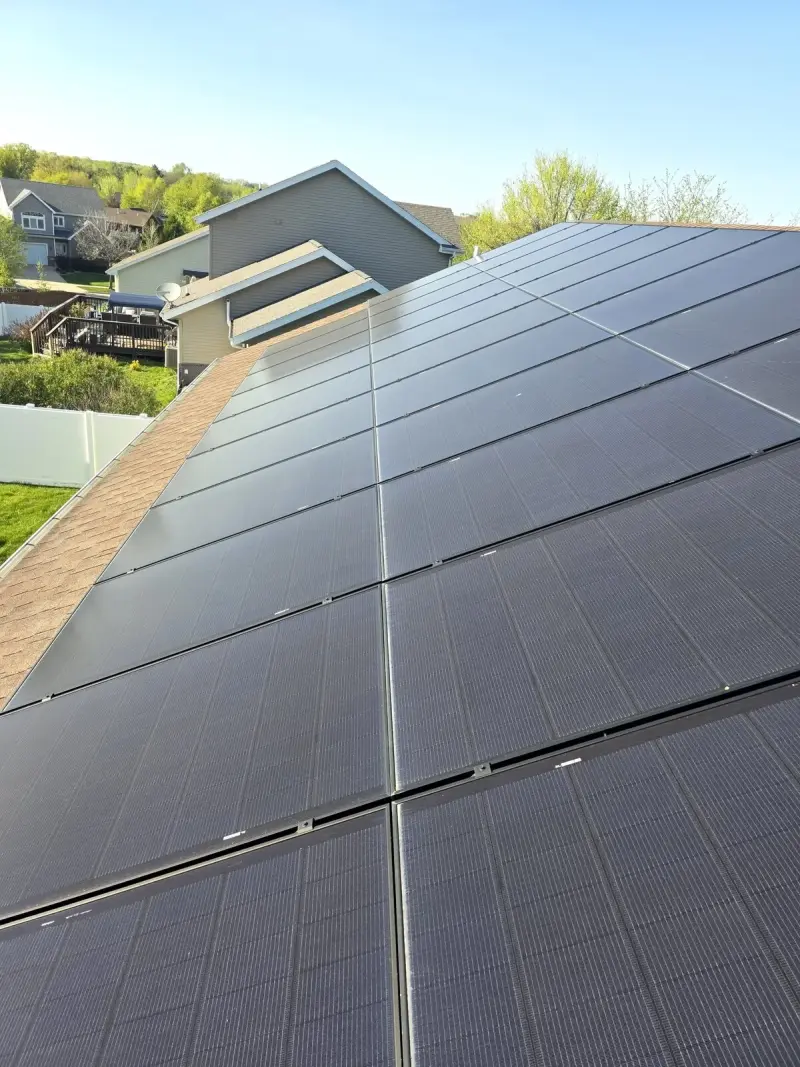
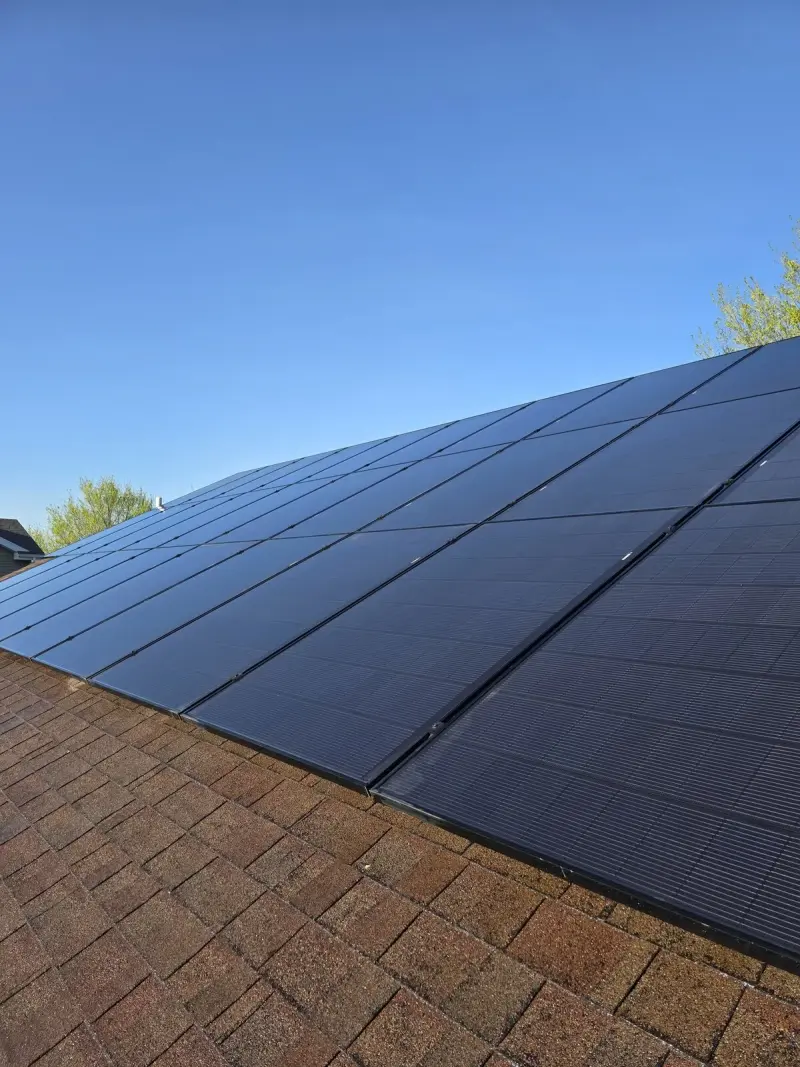
A dirty array does not send you an alert. It just makes less power, quietly, and the shortfall looks like weather. Soiling loss is the gap between what your panels produce dirty and what they would produce clean under the same sun. It can be measured. Here is how the math works, what the research says the realistic ranges are, and how to run the numbers on your own system.
The basic formula
Soiling loss is a percentage:
Soiling loss (%) = (clean production − soiled production) ÷ clean production × 100
Researchers use a related figure called the soiling ratio: actual output divided by the output expected from clean panels. A ratio of 0.95 means a 5% loss. The hard part is not the arithmetic. The hard part is getting an honest clean-versus-dirty comparison, because production also moves with clouds, temperature, season, and shading. A single bad day in your monitoring app proves nothing. A pattern across comparable clear days does.
What the research says the ranges are
NREL puts annual soiling losses for rainy regions like the eastern US at roughly 1–2% per year. That is our climate: regular rain, real winters, no desert dust storms. Across the whole US, annual losses run 0–7%, and soiling can add as much as 1¢/kWh to the cost of the energy a system produces.
Two cautions about those ranges. First, they are averages. Losses are not spread evenly across the year — they concentrate in dry stretches and pollen season, which I get into below. Second, double-digit losses are real but specific. NREL measured pollen cutting output about 15% at peak pollen season on uncleaned utility-scale plants, and about 14% on bio-soiled panels in a lab test. Anyone who tells you dirty panels typically lose 20–30% is selling something. In Wisconsin, plan on the low single digits across a year, with worse stretches when pollen and dry weather stack up.
What I measure on actual roofs
I carry a handheld irradiance meter, and I take a spot reading at the glass before and after a cleaning. Work I performed at the Wisconsin State Capitol measured 16.7% more sunlight reaching the glass after a single cleaning. That is a same-panel spot reading of light at the glass — not a whole-system production figure, and I won't dress it up as one. It tells you how much light the grime was blocking at that spot, on that day.

The clearest full-system number I have is my own house. My 34-panel array was cleaned on May 7, 2025, and production rose from 68.1 kWh to 83.3 kWh the next day — up 22%. That is a next-day comparison, not a lab test, and weather is never identical two days running. I report it as what it is: one dirty array, one cleaning, one very good next day.
The Wisconsin dollar math
Percentages are abstract until you price them. Two published inputs do the work:
- A 1 kW system in Madison produces about 1,231 kWh per year (NREL's PVWatts tool, Madison).
- Wisconsin residential electricity costs about 19.74¢/kWh, above the national average.
Take a typical 8 kW home system. It makes roughly 9,850 kWh a year, worth about $1,944 at that rate. Now run the loss levels:
- 1% loss: ~98 kWh, about $19 a year
- 2% loss: ~197 kWh, about $39 a year
- 5% loss: ~492 kWh, about $97 a year
- 7% loss: ~689 kWh, about $136 a year
That is the honest scale of it. Soiling is not bankrupting a Wisconsin homeowner. It is a slow leak, and whether plugging it is worth money depends on where your array actually sits in that range — which is why measuring beats guessing. The full case for cleaning also includes things the dollar math leaves out: bonded grime gets harder to remove over time, droppings create hot spots, and manufacturers expect documented care (more on that in the warranty post).
How to estimate your own loss
- Pick a stretch of clear days before a cleaning and note daily kWh from your monitoring app. Use kWh, not the app's percentage estimates.
- Note the weather. Cool, crisp days produce more than hot, hazy ones at the same cleanliness.
- After cleaning, compare the next comparable clear days. Average several days on each side if you can.
- Apply the formula above. If output jumped and nothing else changed — no new shading, no inverter errors — most of that jump was the dirt.
If output stays low after a proper cleaning, the problem is probably not dirt. Shading, equipment faults, and inverter issues are electrical work, and I refer that out rather than guess at it.
Want the decision framework for when a measured loss justifies a cleaning? That is the cleaning frequency post. Want to know why rain does not reset the clock? Start with does rain clean solar panels. And if you'd rather skip the math, my published prices are on this site — no form required. Text me at (608) 571-4173 and I'll look at your array by satellite, free.